Statistics#
This page presents statistics of solar irradiance monitoring stations using data from SolarStations.Org.
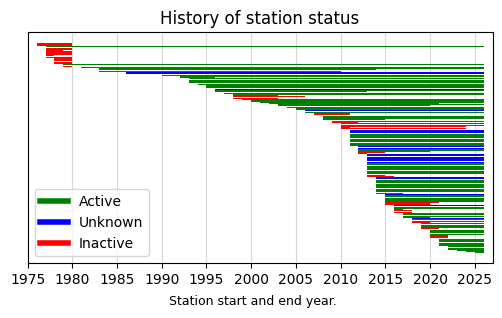
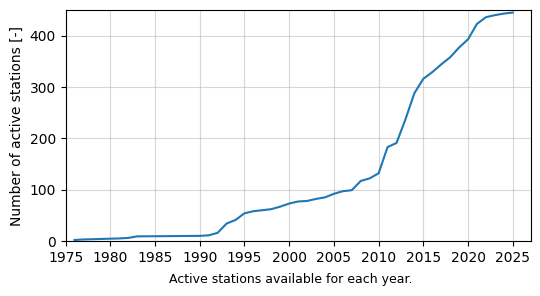
Let’s take a closer look at the current active stations and their measurement records.
The following conclusions can be drawn from the figures above:
There are currently 447 active stations out of the 816 known stations
Of the active stations, only 16 have been in operation before 1993 (~4%)
Most of the active stations (348) have been in operation for less than 20 years (~77%)
There are 114 stations (14%) whose operation status is unknown, which demonstrates a huge barrier to accessing information and data from solar stations!
Dataset duration#
The figure below provides an overview of the operation duration of the active and inactive stations.
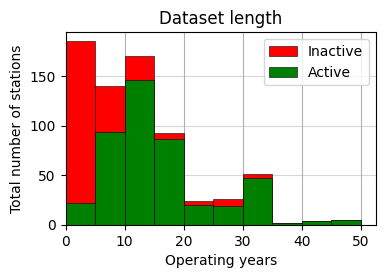
The graph shows that most of the stations with measurement record greater than 15 years remain in operation.
Historical and active stations#
Zooming in on active stations#
The remainder of the plots and statistics will be based only on the Active stations.
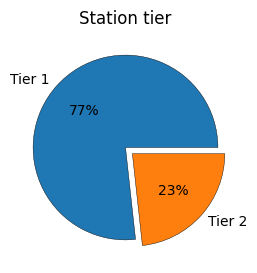
Station tier#
The figure below shows the percentage of active stations categorized as either Tier 1 or Tier 2. It can be observed that most of the active stations are Tier 1, which means that they measure global horizontal irradiance (GHI), diffuse horizontal irradiance (DHI) using a shadow ball, and direct normal irradiance (DNI) using a pyrheliometer mounted on a solar tracker. For more information on the station tier classifications, see the station requirements page.
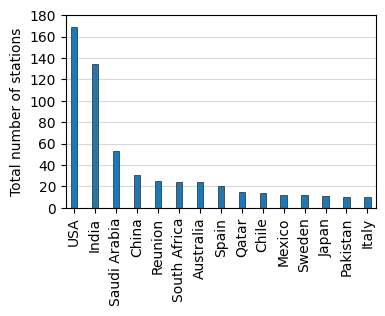
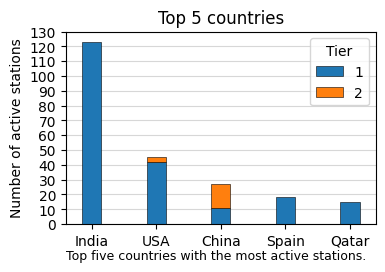
Leading countries#
The figure below shows the number of active stations for the top 5 countries.
Most of the active stations belong to a network, which makes their data easier to access (partly because they usually have a website):
SRRA : 123
ESMAP : 65
BSRN : 59
IOS-net : 22
QEERI : 15
AEMET : 14
enerMENA : 10
WMORRC : 9
WMOGAW : 8
SRML : 7
SOLRAD : 7
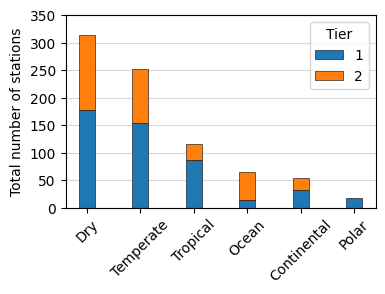
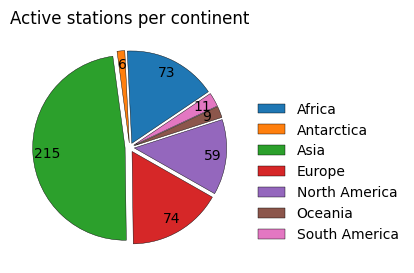
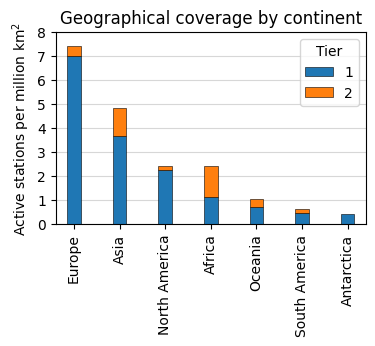
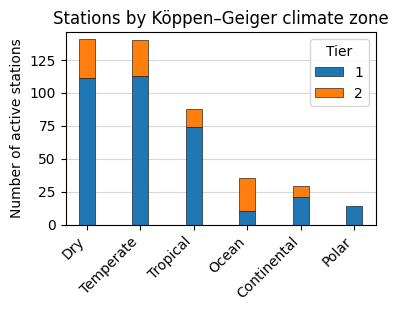
Breakdown by continent and climate#
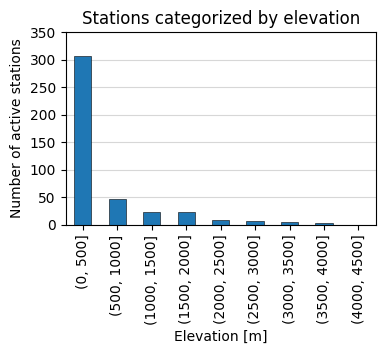
Breakdown by elevation and latitude#

Data availability#
Finding and downloading data from solar stations can be a tedious process. The main reason is that often there is no information on how to obtain the data. There are 227 active stations where data can be freely donwloaded and 182 stations for which there is no data access. The figure shows the corresponding percentages.
