NREL MIDC station network#
The Measurement and Instrumentation Data Center (MIDC) is operated by NREL and provides irradiance and meteorological data from a number of ground stations in the U.S. The stations vary in quality, with some stations measuring all three components with high-quality instruments and other stations featuring a rotating shadow band pyranometer.
Note, the MIDC includes several inactive stations. Also, several of the active stations are no longer cleaned or calibrated frequently. For these reasons, the SolarStations.Org catalog only includes the SRRL BMS, SOLARTAC, and Flatirons M2 sites, as these measures all three irradiance components and are active. See the map below for the locations of the stations.
| Station Identifier | Station name | Station Abbreviation | Latitude | Longitude | Elevation | Active |
|---|---|---|---|---|---|---|
|
Loading ITables v2.2.2 from the init_notebook_mode cell...
(need help?) |
Baseline Measurement System (BMS)#
The most notable station is the Baseline Measurement System (BMS) at NREL’s Solar Radiation Research Laboratory (SRRL) outside of Denver, Colorado. The BMS features the world’s largest collection of operating pyranometers and pyrheliometers. A number of sky imagers, PV reference cells, and spectral radiometers are also located at the site. Instruments at the BMS are cleaned each weekday and frequently calibrated. Due to the large collection of co-located and well maintained instruments, the BMS data is ideal for comparing different types of instruments.
For the three standard components, the main instruments are:
Global CMP22 (vent/cor) [W/m^2]
Diffuse CM22-1 (vent/cor) [W/m^2]
Diffuse CM22-2 (vent/cor) [W/m^2] (main backup)
Direct CHP1-1 [W/m^2]
Direct CHP1-2 [W/m^2] (main backup)p)
Data retrieval#
Data from the MIDC can be retrieved from the MIDC website or using the MIDC raw data API.
Note
If you use data from the MIDC in any publication, make sure to cite it. As an example, the citation for the BMS site is:
Andreas, A.; Stoffel, T.; (1981). NREL Solar Radiation Research Laboratory (SRRL): Baseline Measurement System (BMS); Golden, Colorado (Data); NREL Report No. DA-5500-56488. http://dx.doi.org/10.5439/1052221
Data can be downloaded and parsed conveniently using the pvlib-python iotools module using the function pvlib.iotools.read_midc_raw_data_from_nrel. If you use pvlib iotools for published work, please Jensen et al. (2023) which provides additional background information. The use of the function is shown below, demonstrating how to retrieve five days of data:
import pvlib

data = pvlib.iotools.read_midc_raw_data_from_nrel(
    site='BMS',  # station identifier
    start=pd.Timestamp(2020,6,1),
    end=pd.Timestamp(2020,6,5))

# show a subset of the data
show(data.iloc[:5, 5:10], dom="tpr")
| CR3000 Zen Angle [degrees] | Global LI-200 [W/m^2] | Global CMP22 (vent/cor) [W/m^2] | Global RG780 PSP [W/m^2] | Global CM3 (cor) [W/m^2] | |
|---|---|---|---|---|---|
|
Loading ITables v2.2.2 from the init_notebook_mode cell...
(need help?) |
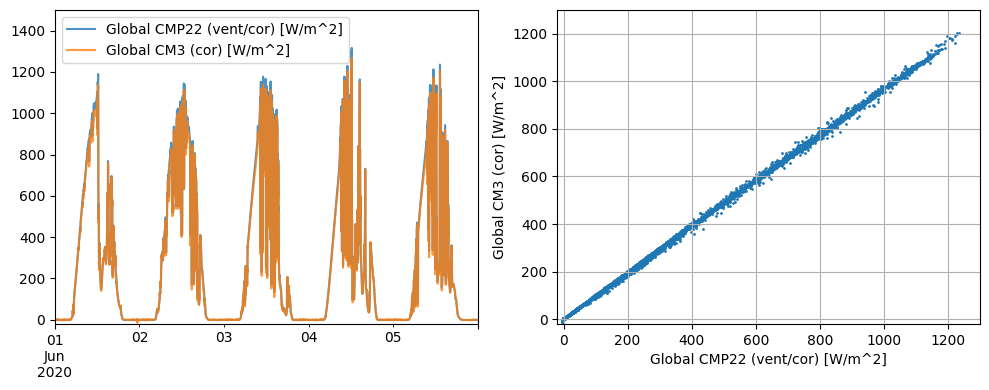
The retrieved BMS dataset contains numerous instruments measuring the same irradiance component. Let’s, for example, compare the global horizontal irradiance (GHI) measured by a high-quality CMP22 pyranometer with that of a low-cost CM3 pyranometer:
Show code cell source
import matplotlib.pyplot as plt

fig, axes = plt.subplots(ncols=2, figsize=(10,4))
# plot both measurement as a time-series
data[['Global CMP22 (vent/cor) [W/m^2]', 'Global CM3 (cor) [W/m^2]']].plot(
    ax=axes[0], alpha=0.8, ylim=[-20, 1500])
# compare measurements with a scatter plot
data.plot.scatter(ax=axes[1], s=1, grid=True,
                  x='Global CMP22 (vent/cor) [W/m^2]',
                  y='Global CM3 (cor) [W/m^2]',
                  xlim=[-20, 1300], ylim=[-20, 1300])
fig.tight_layout()
References#
Adam R. Jensen, Kevin S. Anderson, William F. Holmgren, Mark A. Mikofski, Clifford W. Hansen, Leland J. Boeman, and Roel Loonen. Pvlib iotools—open-source python functions for seamless access to solar irradiance data. Solar Energy, 266:112092, 2023. doi: 10.1016/j.solener.2023.112092.