Baseline Surface Radiation Network (BSRN)#
The Baseline Surface Radiation Network (BSRN) is a global network of high-quality solar irradiance monitoring stations under the World Climate Research Programme (WCRP) (Driemel et al., 2018). The procedures of the BSRN are described in great detail in the BSRN Operations Manual Version 2.1.
According to the World Radiation Monitoring Center (WRMC):
The data [from the BSRN stations] are of primary importance in supporting the validation and confirmation of satellite and computer model estimates of these quantities. At a small number of stations (currently 74 in total, 58 active) in contrasting climatic zones, covering a latitude range from 80°N to 90°S, solar and atmospheric radiation is measured with instruments of the highest available accuracy and with high time resolution.
A list of active, inactive, and candidate BSRN stations can be retrieved from the SolarStations.Org station catalog and are shown on the map below.
| Station name | Abbreviation | State | Country | Latitude | Longitude | Elevation | Time period | Network | Owner | Comment | Data availability | Instrumentation |
|---|---|---|---|---|---|---|---|---|---|---|---|---|
|
Loading ITables v2.2.2 from the init_notebook_mode cell...
(need help?) |
Station requirements#
All BSRN stations are required to meet the basic station requirements, which include measuring direct normal (DNI), diffuse horizontal (DHI), global horizontal (GHI), and down-welling long-wave (LWD) irradiance.
Additional metadata may be found at the BSRN website and in the individual data files (e.g., horizon profile).
Note
Unlike some solar irradiance monitoring networks, the BSRN website does not have a subpage for each station (with photos, etc.). This would have been very useful when assessing the usage of the station, for example, in regards to the potential impact of nearby structures, etc. Note a few photos of the BSRN stations can be found here. The station logbooks are also not available.
It should be noted that many of the BSRN stations are also part of national station networks. For example, the Southern Great Plains and the Eastern North Atlantic sites are part of the ARM program under the US Department of Energy. Similarly, all of the stations in the SURFRAD network all part of the BSRN.
Data quality#
It should be noted that BSRN stations do not receive specific funding but rely on national funding (e.g., meteorological institutes or research organizations) which represents a serious challenge when making long-term measurements. While the instrumentation used at BSRN stations represents the state-of-the-art, quality procedures and maintenance practices vary greatly, and consequently data quality. For example, the Cabauw (CAB) station is a station with a generally very high data quality partly owing to station inspections each work day. In contrast, data from the Brasilia (BRB), Gandhinagar (GAN), and Gurgaon (GUR) stations have been found to have periods with low data quality. In short, any kind of irradiance measurements should not be used without meticulous inspection by the data user.
Warning
WRMC highly recommends that all users do their own quality checks of the data after extracting BSRN-data!
Data retrieval#
Data from the BSRN stations are stored in monthly files for each station and can be freely downloaded either via FTP or from the Pangea data portal (the data is identical to the data on Pangea. Credentials for accessing the BSRN FTP server can be obtained as described in the data release guidelines. All of the files on the FTP server are in the rather archaic station-to-archive file format, which is described in the Update of the Technical Plan for BSRN data management. There is no standard for when data becomes available, which can vary between a few months to more than a year.
Data release guidelines
Please read the BSRN data release guidelines before using any data and make sure to properly cite the BSRN.
The station-to-archive files can be parsed and downloaded using the pvlib-python library, specifically the pvlib.iotools.get_bsrn function. If you use the pvlib iotools for published work, please cite Jensen et al. (2023) which provides additional background information. An example of how to use pvlib to download two months of data from the Cabauw (CAB) station is shown below:
import pvlib

df, meta = pvlib.iotools.get_bsrn(
    station='CAB',  # three letter code for the Cabauw station
    start=pd.Timestamp(2018,6,1),
    end=pd.Timestamp(2018,7,14),
    username=bsrn_username,  # replace with your own username
    password=bsrn_password,  # replace with your own password
)

show(df.head(), scrollX=True, scrollCollapse=True, paging=False, maxColumns=100, dom="tpr")
Show code cell output
/opt/hostedtoolcache/Python/3.12.12/x64/lib/python3.12/site-packages/pvlib/iotools/bsrn.py:162: FutureWarning: 'M' is deprecated and will be removed in a future version, please use 'ME' instead.
  filenames = pd.date_range(
| ghi | ghi_std | ghi_min | ghi_max | dni | dni_std | dni_min | dni_max | dhi | dhi_std | dhi_min | dhi_max | lwd | lwd_std | lwd_min | lwd_max | temp_air | relative_humidity | pressure | |
|---|---|---|---|---|---|---|---|---|---|---|---|---|---|---|---|---|---|---|---|
|
Loading ITables v2.2.2 from the init_notebook_mode cell...
(need help?) |
For a description of the input parameters, see the pvlib documentation.
Retrieving BSRN data in R
R users can find similar functionality in the SolarData R package.
The data retrieved from all BSRN stations includes measurements of the three irradiance components, as well as longwave downwelling irradiance, temperature, and humidity.
A few of the parameters in the retrieved dataset are visualized below:
Show code cell source
axes = df[['ghi','dni','dhi','lwd','temp_air']].plot(
    subplots=True, legend=False, rot=0, figsize=(8,8), sharex=True)

# Set y-labels and y-limits
axes[0].set_ylabel('GHI [W/m$^2$]'), axes[0].set_ylim(-10,1300)
axes[1].set_ylabel('DNI [W/m$^2$]'), axes[1].set_ylim(-10,1300)
axes[2].set_ylabel('DHI [W/m$^2$]'), axes[2].set_ylim(-10,1300)
axes[3].set_ylabel('LWD [W/m$^2$]'), axes[4].set_ylim(200,500)
_ = axes[4].set_ylabel('Temperature [°]'), axes[4].set_ylim(0,40)
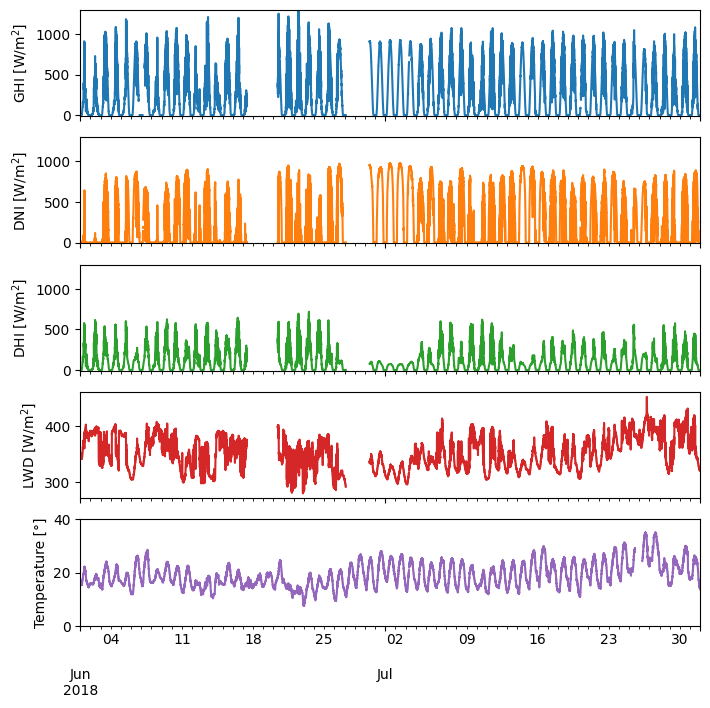
Notice how there are multiple periods where there is gaps in the irradiance data.
References#
A. Driemel, J. Augustine, K. Behrens, S. Colle, C. Cox, E. Cuevas-Agulló, F. M. Denn, T. Duprat, M. Fukuda, H. Grobe, M. Haeffelin, G. Hodges, N. Hyett, O. Ijima, A. Kallis, W. Knap, V. Kustov, C. N. Long, D. Longenecker, A. Lupi, M. Maturilli, M. Mimouni, L. Ntsangwane, H. Ogihara, X. Olano, M. Olefs, M. Omori, L. Passamani, E. B. Pereira, H. Schmithüsen, S. Schumacher, R. Sieger, J. Tamlyn, R. Vogt, L. Vuilleumier, X. Xia, A. Ohmura, and G. König-Langlo. Baseline surface radiation network (BSRN): structure and data description (1992–2017). Earth System Science Data, 10(3):1491–1501, 2018. doi: 10.5194/essd-10-1491-2018.
Adam R. Jensen, Kevin S. Anderson, William F. Holmgren, Mark A. Mikofski, Clifford W. Hansen, Leland J. Boeman, and Roel Loonen. Pvlib iotools—open-source python functions for seamless access to solar irradiance data. Solar Energy, 266:112092, 2023. doi: 10.1016/j.solener.2023.112092..