SOLRAD#
The SOLRAD network consists of 9 surface radiation monitoring stations and is operated by the National Oceanic and Atmospheric Administration (NOAA).
The reader is referred to Hicks et al. (1996) for background information on the SOLRAD network.
Instrument calibrations
A list all instruments that have been used and their respective calibration coefficients can be found here.
| Station name | Abbreviation | State | Country | Latitude | Longitude | Elevation | Time period | Network | Owner | Comment | Data availability | Instrumentation |
|---|---|---|---|---|---|---|---|---|---|---|---|---|
|
Loading ITables v2.2.2 from the init_notebook_mode cell...
(need help?) |
Data retrieval#
Measurements from the SOLRAD stations are stored in daily ASCII text files and can be freely downloaded from the SOLRAD FTP server. Since January 1st 2015, data has been logged as 1-minute averages of 1-second samples. Prior to this, the data was stored as 3-minute averages.
Data can be downloaded and parsed conveniently using the pvlib-python iotools module using the function pvlib.iotools.get_solrad. If you use pvlib iotools for published work, please cite Jensen et al. (2023) which provides additional background information. The use of the function is shown below, demonstrating how to retrieve five days of data:
import pvlib

data, meta = pvlib.iotools.get_solrad(
    station='ABQ',  # station identifier
    start=pd.Timestamp(2020,6,1),
    end=pd.Timestamp(2020,6,5))

# show a subset of the data
show(data.iloc[:, 7:], dom="tpr")
Show code cell output
| solar_zenith | ghi | ghi_flag | dni | dni_flag | dhi | dhi_flag | uvb | uvb_flag | uvb_temp | uvb_temp_flag | std_dw_psp | std_direct | std_diffuse | std_uvb | |
|---|---|---|---|---|---|---|---|---|---|---|---|---|---|---|---|
|
Loading ITables v2.2.2 from the init_notebook_mode cell...
(need help?) |
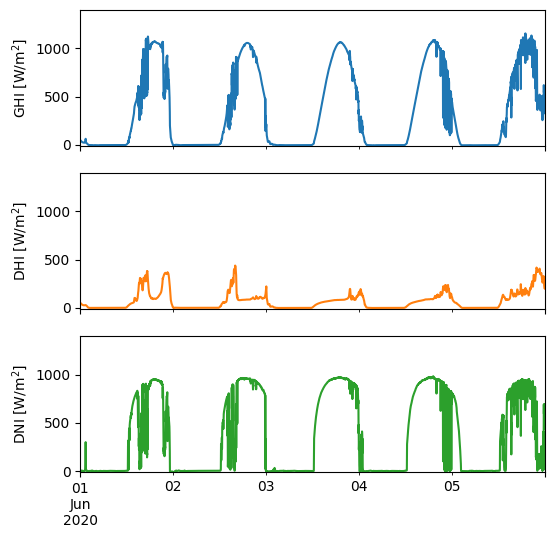
Show code cell source
columns = ['ghi', 'dhi', 'dni']
axes = data[columns].plot(
    subplots=True, legend=False, rot=0, figsize=(6, 6), sharex=True)

# Set y-labels and y-limits
for ax, column in zip(axes, columns):
    ax.set_ylabel(f"{column.upper()} [W/m$^2$]")
    ax.set_ylim(-10, 1400)
References#
Adam R. Jensen, Kevin S. Anderson, William F. Holmgren, Mark A. Mikofski, Clifford W. Hansen, Leland J. Boeman, and Roel Loonen. Pvlib iotools—open-source python functions for seamless access to solar irradiance data. Solar Energy, 266:112092, 2023. doi: 10.1016/j.solener.2023.112092.
B. B. Hicks, J. J. DeLuisi, and D. R. Matt. The NOAA integrated surface irradiance study (ISIS) - a new surface radiation monitoring program. Bulletin of the American Meteorological Society, 77(12):2857–2864, 1996. doi: 10.1175/1520-0477(1996)077<2857:TNISIS>2.0.CO;2.