This page presents an overview of the Eye2Sky cloud camera network in north-west Germany. Part of the dataset has been made public on Zenodo, and an example of how to retrieve data using Python is provided. See Schmidt et al. (2023) for more information.
“In north-west Germany between Oldenburg, the North Sea coast and the Dutch border, the Institute of Networked Energy Systems operates the unique Eye2Sky cloud camera network as a research infrastructure. The network is growing dynamically and currently consists of around 30 stations. The heart of each station is a cloud camera, also known as an all-sky imager (ASI). This is a commercially available webcam with a fisheye lens supplemented by a ventilation and heating system that ensures optimum image quality even in bad weather. A third of the stations are equipped with a rotating shadowband irradiometer (RSI), other radiation sensors and meteorological sensors for temperature and humidity, for example, to validate and calibrate the algorithms.”
List and map of stations
The Eye2sky comprises of around 30 stations with different characteristics, which are provided in the table below. Common for all stations is that they are located in north-western Germany as shown on the map below.
Data retreival
A part of the Eye2sky dataset has been released freely on Zenodo. The below section demonstrates how this dataset can be read and what datafield are available.
Notebook Cell
def get_eye2sky(station, start, end, file_type='cleaned', url=EYE2SKY_BASE_URL):
    """
    Retrieve ground-measured meteorological and solar irradiance data from the Eye2sky network.

    The Eye2Sky network [1]_ consists of 29 all-sky imager stations, of which 12 are equipped
    with meteorological sensors in the northwest of Germany. Instrumentation at stations varies,
    while all measure global horizontal irradiance, tilted irradiance, as well as temperature and humidity.
    Several stations measure diffuse horizontal and direct normal irradiance with a rotating shadowband irradiometer.
    Two Tier 1 stations have solar trackers measuring global, direct, and diffuse irradiance with thermopile sensors.

    Data is provided in two ways:
    1. Raw data, including quality flags from an in-house quality control procedure
    2. Cleaned data where data failing the quality control procedure has been removed

    Additionally, clear sky irradiance data and relative solar positions used for the QC are provided.

    Temporal resolution is 1 minute.

    Data is available from Zenodo [2]_.

    Parameters
    ----------
    station: str or list
        Station ID (5-digit ID). All stations can be requested by specifying
        station='all'.
    start: datetime-like
        First day of the requested period
    end: datetime-like
        Last day of the requested period
    file_type: str, default : 'cleaned'
        Data version: "flagged" (L0 - raw + flags) or "cleaned" (L1 - based on QC)

    Returns
    -------
    data: xarray Dataset
        Dataset of timeseries data from the Eye2Sky measurement network.

    Warns
    -----
    UserWarning
        If one or more requested files are missing, a UserWarning is returned.

    Examples
    --------
    >>> # Retrieve 2 weeks of data from Eye2Sky station OLWIN
    >>> data = get_eye2sky('OLWIN','2022-05-21','2022-07-21', type="cleaned")  # doctest: +SKIP

    References
    ----------
    .. [1] `Schmidt, Thomas; Stührenberg, Jonas; Blum, Niklas; Lezaca, Jorge; Hammer, Annette; Vogt, Thomas (2022)
            A network of all sky imagers (ASI) enabling accurate and high-resolution very short-term forecasts of solar irradiance**.
            In: Wind & Solar Integration Workshop. IET Digital Library. 21st Wind & Solar Integration Workshop, 12.14. Okt. 2022, The Hague, Netherlands.
            DOI:
            <https://doi.org/10.1049/icp.2022.2778/>`_
    .. [2] `Zenodo
       <https://zenodo.org/records/12804613>`_
    """
    zipped_archive_url = os.path.join(EYE2SKY_BASE_URL, f"{station}.zip")

    response = requests.get(zipped_archive_url)

    zip_data = io.BytesIO(response.content)

    with zipfile.ZipFile(zip_data, "r") as zip_file:
        # List all files in the ZIP archive
        # print(zip_file.namelist())

        filename = f"data/{station}.{file_type}.nc"

        # Open a specific file inside the ZIP without extracting
        with zip_file.open(filename) as nc_file:
            nc_data = io.BytesIO(nc_file.read())  # Load NetCDF file into memory
            ds = xr.load_dataset(nc_data).sel(time=slice(start, end))

    return ds
data = get_eye2sky('OLWIN', '2022-07-21', '2022-07-26', file_type='cleaned')
data['cDNI'].plot()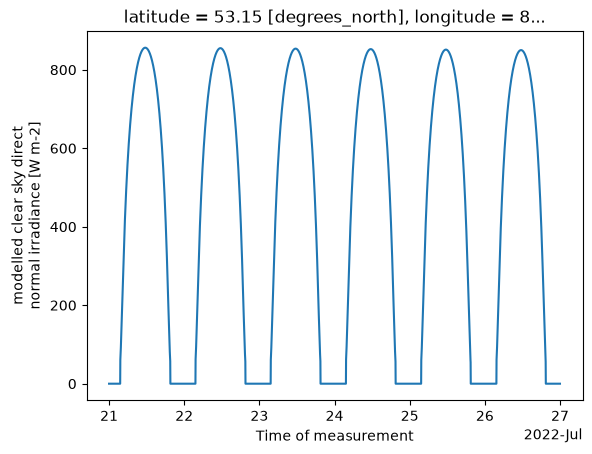
What is returned?
dataData attributes
data.attrs{'grid_mapping_name': 'latitude_longitude',
'longitude_of_prime_meridian': '0.0',
'semi_major_axis': '6378137.0',
'inverse_flattening': '298.257223563',
'epsg_code': 'EPSG:4326',
'title': 'Timeseries of solar irradiance and meteorological measurements in Eye2Sky network from station: OLWIN',
'summary': 'Measurements from ground-based instruments from the Eye2Sky network. The network is operated by DLR Institute of Networked Energy Systems in Oldenburg. First stations are measuring since 2018.',
'keywords': 'solar irradiance, air temperature, relative humidity, meteorology, atmospheric radiation, measurement station',
'featureType': 'timeSeries',
'network_id': 'Eye2Sky',
'platform': 'Eye2Sky',
'network_region': 'North-West Germany',
'station_country': 'Germany',
'creator_name': 'Jonas Stührenberg (jonas.stuehrenberg@dlr.de)',
'publisher_email': 'jonas.stuehrenberg@dlr.de,th.schmidt@dlr.de',
'publisher_name': 'Thomas Schmidt',
'publisher_institution': 'DLR Deutsches Luft- und Raumfahrtzentrum e.V / German Aerospace Center',
'publisher_url': 'www.dlr.de',
'resolution': 'P1M',
'time_coverage_resolution': 'P1M',
'station_id': 'OLWIN',
'station_uid': '',
'station_wmo_id': '',
'station_city': '',
'climate': 'cfb',
'operation_status': '',
'id': 'OLWIN',
'latitude': np.float64(53.15348),
'longitude': np.float64(8.16192),
'elevation': np.int64(21),
'height': np.int64(15),
'license': 'https://cdla.dev/sharing-1-0/',
'qc_level': 'quality controlled + cleaned data',
'surface_type': 'roof,pebbles',
'topography_type': 'flat',
'rural_urban': 'suburban'}Which variables exist?
data.variablesOutput
Frozen({'cDNI': <xarray.Variable (time: 8640)> Size: 69kB
array([-0., -0., -0., ..., -0., -0., -0.], shape=(8640,))
Attributes:
    DIMENSION_LABELS:         time
    long_name:                modelled clear sky direct normal irradiance
    standard_name:            clear_sky_dni
    abbreviation:             cDNI
    units:                    W m-2
    _valid_min_:              0
    _valid_max_:              3000
    grid_mapping:             crs
    least_significant_digit:  1, 'RH': <xarray.Variable (time: 8640)> Size: 69kB
array([75., 76., 76., ..., 82., 82., 82.], shape=(8640,))
Attributes: (12/15)
    DIMENSION_LABELS:         time
    orig_name:                relative humidity
    interval_type:            left_closed/right_open/label_right
    meas_type:                mean
    sensor_brand:             Campbell Scientific
    sensor_model:             CS215
    ...                       ...
    abbreviation:             RH
    units:                    %
    _valid_min_:              0
    _valid_max_:              105
    grid_mapping:             crs
    least_significant_digit:  1, 'cGHI': <xarray.Variable (time: 8640)> Size: 69kB
array([0., 0., 0., ..., 0., 0., 0.], shape=(8640,))
Attributes:
    DIMENSION_LABELS:         time
    long_name:                modelled clear sky global irradiance
    standard_name:            clear_sky_ghi
    abbreviation:             cGHI
    units:                    W m-2
    _valid_min_:              0
    _valid_max_:              3000
    grid_mapping:             crs
    least_significant_digit:  1, 'RAIN': <xarray.Variable (time: 8640)> Size: 69kB
array([0., 0., 0., ..., 0., 0., 0.], shape=(8640,))
Attributes: (12/14)
    DIMENSION_LABELS:  time
    orig_name:         precipitation in mm of height per m2 of area
    interval_type:     left_closed/right_open/label_right
    meas_type:         sum
    sensor_brand:      Thies Clima
    sensor_model:      5.4032.35.008
    ...                ...
    long_name:         Precipitation
    standard_name:     precipitation
    abbreviation:      RAIN
    _valid_min_:       0.0
    _valid_max_:       100
    grid_mapping:      crs, 'turbidity': <xarray.Variable (time: 8640)> Size: 69kB
array([3.62513595, 3.62514051, 3.62514508, ..., 3.66454813, 3.66455269,
       3.66455726], shape=(8640,))
Attributes:
    DIMENSION_LABELS:         time
    long_name:                atmospheric turbidity used in clear sky model
    standard_name:            turbidity
    abbreviation:             turbidity
    _valid_min_:              0
    _valid_max_:              100
    grid_mapping:             crs
    least_significant_digit:  1, 'SAZ': <xarray.Variable (time: 8640)> Size: 69kB
array([6.39897563, 6.64197964, 6.8849144 , ..., 5.70202943, 5.94879244,
       6.19549101], shape=(8640,))
Attributes:
    DIMENSION_LABELS:         time
    long_name:                solar_azimuth_angle
    standard_name:            solar azimuth angle
    abbreviation:             SAZ
    units:                    degrees
    _valid_min_:              0
    _valid_max_:              360
    grid_mapping:             crs
    least_significant_digit:  1, 'GHI': <xarray.Variable (time: 8640)> Size: 69kB
array([1.8, 1.8, 2. , ..., 1.3, 1.2, 1.4], shape=(8640,))
Attributes: (12/15)
    DIMENSION_LABELS:         time
    orig_name:                reference global irradiance
    interval_type:            left_closed/right_open/label_right
    meas_type:                avg
    sensor_brand:             EKO
    sensor_model:             MS-80
    ...                       ...
    abbreviation:             GHI
    units:                    W m-2
    valid_min_:               0.0
    valid_max_:               3000
    grid_mapping:             crs
    least_significant_digit:  1, 'DNI': <xarray.Variable (time: 8640)> Size: 69kB
array([-0.1, -0.1, -0.1, ..., -0. , -0. , -0. ], shape=(8640,))
Attributes: (12/15)
    DIMENSION_LABELS:         time
    orig_name:                reference direct normal irradiance
    interval_type:            left_closed/right_open/label_right
    meas_type:                avg
    sensor_brand:             EKO
    sensor_model:             MS-56
    ...                       ...
    abbreviation:             DNI
    units:                    W m-2
    valid_min_:               0.0
    valid_max_:               3000
    grid_mapping:             crs
    least_significant_digit:  1, 'T': <xarray.Variable (time: 8640)> Size: 69kB
array([20.2, 20.2, 20.2, ..., 12.4, 12.4, 12.4], shape=(8640,))
Attributes: (12/15)
    DIMENSION_LABELS:         time
    orig_name:                air temperature
    interval_type:            left_closed/right_open/label_right
    meas_type:                mean
    sensor_brand:             Campbell Scientific
    sensor_model:             CS215
    ...                       ...
    abbreviation:             T
    units:                    degrees Celsius
    _valid_min_:              -90
    _valid_max_:              60
    grid_mapping:             crs
    least_significant_digit:  1, 'DHI': <xarray.Variable (time: 8640)> Size: 69kB
array([-0. ,  0. ,  0.1, ..., -0.1, -0.1, -0. ], shape=(8640,))
Attributes: (12/15)
    DIMENSION_LABELS:         time
    orig_name:                reference diffuse irradiance
    interval_type:            left_closed/right_open/label_right
    meas_type:                avg
    sensor_brand:             EKO
    sensor_model:             MS-80
    ...                       ...
    abbreviation:             DHI
    units:                    W m-2
    valid_min_:               0.0
    valid_max_:               3000
    grid_mapping:             crs
    least_significant_digit:  1, 'cDHI': <xarray.Variable (time: 8640)> Size: 69kB
array([0., 0., 0., ..., 0., 0., 0.], shape=(8640,))
Attributes:
    DIMENSION_LABELS:         time
    long_name:                modelled clear sky diffuse irradiance
    standard_name:            clear_sky_dhi
    abbreviation:             cDHI
    units:                    W m-2
    _valid_min_:              0
    _valid_max_:              3000
    grid_mapping:             crs
    least_significant_digit:  1, 'SZA': <xarray.Variable (time: 8640)> Size: 69kB
array([106.09121102, 106.07432022, 106.05679794, ..., 107.39106797,
       107.37600768, 107.36030525], shape=(8640,))
Attributes:
    DIMENSION_LABELS:         time
    long_name:                solar_zenith_angle
    standard_name:            solar zenith angle
    abbreviation:             SZA
    units:                    degrees
    _valid_min_:              0
    _valid_max_:              180
    grid_mapping:             crs
    least_significant_digit:  1, 'station_name': <xarray.Variable ()> Size: 20B
array('OLWIN', dtype='<U5')
Attributes:
    standard_name:  platform_name
    long_name:      station name
    cf_role:        timeseries_id, 'crs': <xarray.Variable ()> Size: 8B
array(-999), 'time': <xarray.IndexVariable 'time' (time: 8640)> Size: 69kB
array(['2022-07-21T00:00:00.000000000', '2022-07-21T00:01:00.000000000',
       '2022-07-21T00:02:00.000000000', ..., '2022-07-26T23:57:00.000000000',
       '2022-07-26T23:58:00.000000000', '2022-07-26T23:59:00.000000000'],
      shape=(8640,), dtype='datetime64[ns]')
Attributes:
    long_name:      Time of measurement
    standard_name:  time
    abbreviation:   Date/Time
    axis:           T
    resolution:     P1M
    time_zone:      UTC
    time_origin:    1970-01-01 00:00:00, 'latitude': <xarray.Variable ()> Size: 8B
array(53.15348)
Attributes:
    long_name:      station latitude
    standard_name:  latitude
    units:          degrees_north
    axis:           Y, 'longitude': <xarray.Variable ()> Size: 8B
array(8.16192)
Attributes:
    long_name:      station longitude
    standard_name:  longitude
    units:          degrees_east
    axis:           X, 'elevation': <xarray.Variable ()> Size: 8B
array(15)
Attributes:
    long_name:      Elevation above mean sea level
    standard_name:  height_above_mean_sea_level
    units:          m
axis: Z})data['GHI'].attrsOutput
{'DIMENSION_LABELS': 'time',
 'orig_name': 'reference global irradiance',
 'interval_type': 'left_closed/right_open/label_right',
 'meas_type': 'avg',
 'sensor_brand': 'EKO',
 'sensor_model': 'MS-80',
 'sensor_type': 'thermopile pyranometer',
 'long_name': 'Global Horizontal Irradiance',
 'standard_name': 'surface_downwelling_shortwave_flux_in_air',
 'abbreviation': 'GHI',
 'units': 'W m-2',
 'valid_min_': np.float64(0.0),
 'valid_max_': np.int64(3000),
 'grid_mapping': 'crs',
 'least_significant_digit': np.int64(1)}
Visualize data
To visualize the data, the below code cells demonstrate how to plot a single day of GHI data.
Source
plt.figure(figsize=(12,4))
data['GHI'].sel(time='2022-07-23').plot()
plt.show()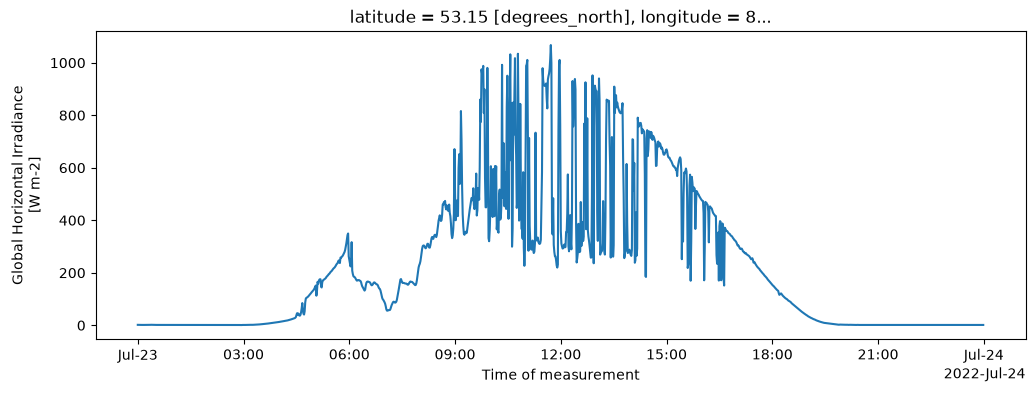
Multiple irradiance components
Some station measure all three standard irradiance components: GHI, DHI, and DNI.
Let’s take a look at measurements from the OLWIN station.
Source
plt.figure()
data['GHI'].sel(time='2022-07-23').plot(lw=0.6, label="GHI")
data['DHI'].sel(time='2022-07-23').plot(lw=0.6, label="DHI")
data['DNI'].sel(time='2022-07-23').plot(lw=0.6, label="DNI")
plt.legend()
plt.show()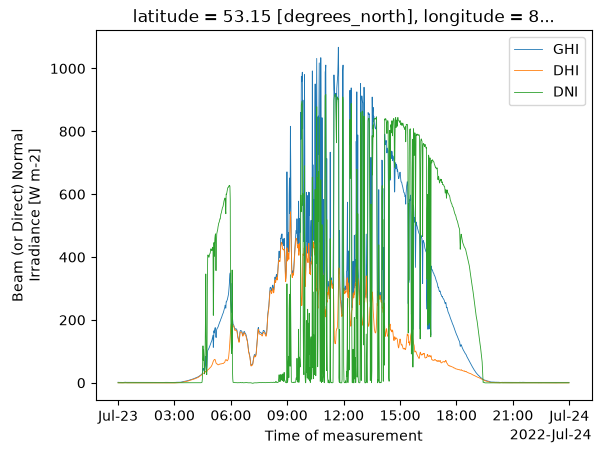
A good way to quality control multi-component irradiance datasets is to compare the measure GHI measurements with the sum of diffuse and direct measurements.
Source
ghi = data['GHI'].sel(time='2022-07-23')
dhi = data['DHI'].sel(time='2022-07-23')
dni = data['DNI'].sel(time='2022-07-23')
solar_zenith = data['SZA'].sel(time='2022-07-23')
ghi_calc = dhi + dni * np.cos(np.radians(solar_zenith))

plt.figure()
(ghi -  ghi_calc).plot()
plt.ylabel('GHI_meas - GHI_calc [W/m$^2$]')
plt.show()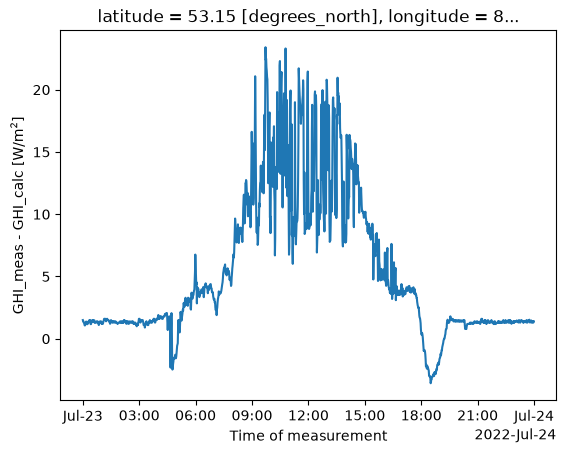
Raw data and QC flags
In this section we will dive into the quality control flags which are provided with the dataset.
As a first step, we retrieve Eye2sky data with flags:
data = get_eye2sky(
    station='WITTM',
    start='2022-07-21',
    end='2022-07-25',
    file_type='flagged',
)
DNI flags
par = 'DNI'

# Test Names
qc_name = data[f'{par}.flag'].attrs['name'].split(',')
# Test Codes
qc_code = data[f'{par}.flag'].attrs['code'].split(',')
# Test actions (how is data that failed tests treated in the cleaned data file)
qc_action = data[f'{par}.flag'].attrs['l1_action'].split(',')
# A description / long name of each test
qc_desc = data[f'{par}.flag'].attrs['description'].split(',')

tests = pd.DataFrame([qc_name, qc_code, qc_action], index=['Name', 'Code', 'Action'])
show(tests)Timeseries of flag values
data[f'{par}.flag'].plot()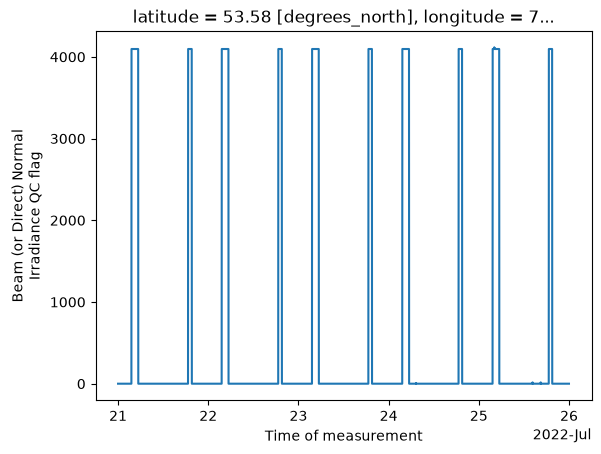
Decode the Flags and make them human-readable
# This function decodes flag decimal value and returns a dictionary of boolean True/False for each single test
def decoding_flgs(dset, test_names):
    # Number of tests (code 0 == valid is not counting)
    tests = test_names[1:]
    ntests = len(tests)
    dec = np.copy(dset)
    flgs = (np.repeat(np.zeros(ntests), len(dec))).reshape(len(dec), ntests)
    for i in range(0, len(dec)):
        for j in range(0, len(flgs[i])):
            flgs[i][j] = dec[i] % 2
            dec[i] = dec[i] // 2
    df = {}
    for i, col in enumerate(tests):
        df[col] = flgs[:,i].astype(bool)
    return df
# Decode also the .test variable. It contains information if the test has been applied to the parameter or not
flags = data[f'{par}.flag']
tests = data[f'{par}.test']
tests = decoding_flgs(tests, qc_desc)
flags = decoding_flgs(flags, qc_desc)Print some statistics
# Print statistics
for key, value in flags.items():
    # only if test has been applied
    if all(tests[key]):
        if any(value):
            # Check for flags
            ind = value == True
            # Check for consecutive flags (-> periods)
            ind = np.diff(ind,prepend=False)
            periods = data['time'][ind].values.reshape(int(np.sum(ind)/2),2)
            print(f'QC failed for test "{key}"')
            print(f'Number of data points {len(periods)} ({100*len(periods)/len(data['time']):.2f} %)')
            #for i in range(periods.shape[0]):
QC failed for test "tracking error"
Number of data points 1 (0.01 %)
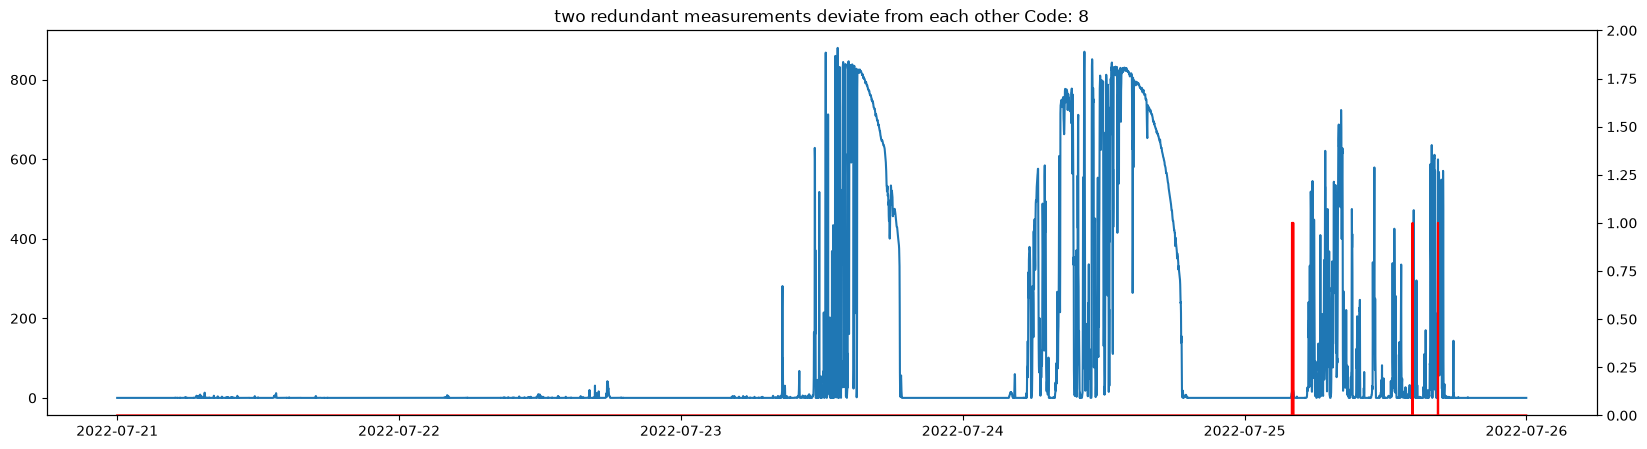
QC failed for test "two redundant measurements deviate from each other"
Number of data points 5 (0.07 %)
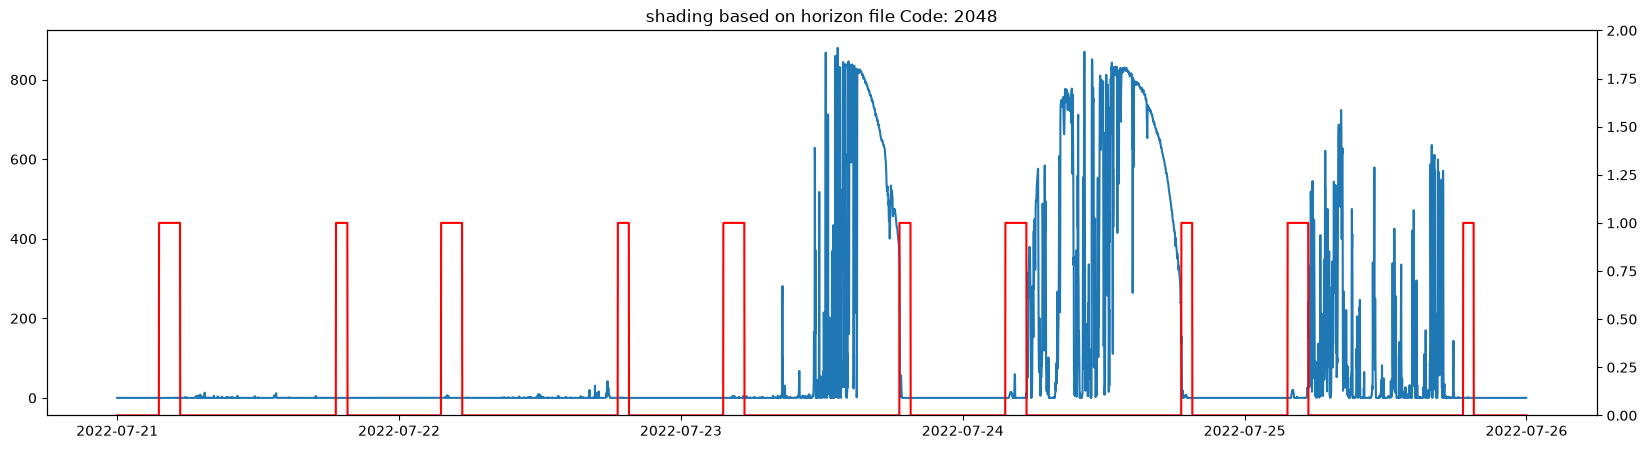
QC failed for test "shading based on horizon file"
Number of data points 10 (0.14 %)
Make a plot for each single test
Source
# Plot graphs
import matplotlib.pyplot as plt
for idx, (key, value) in enumerate(flags.items()):
    if all(tests[key]):
        if any(value):
            fig, ax = plt.subplots(figsize=(20,5))
            ax2 = ax.twinx()
            ax.plot(data['time'], data[par])
            ax2.plot(data['time'], value, c="r")
            ax2.set_ylim(0,2)
            plt.title(f'{key} Code: {qc_code[idx]}')
            plt.show()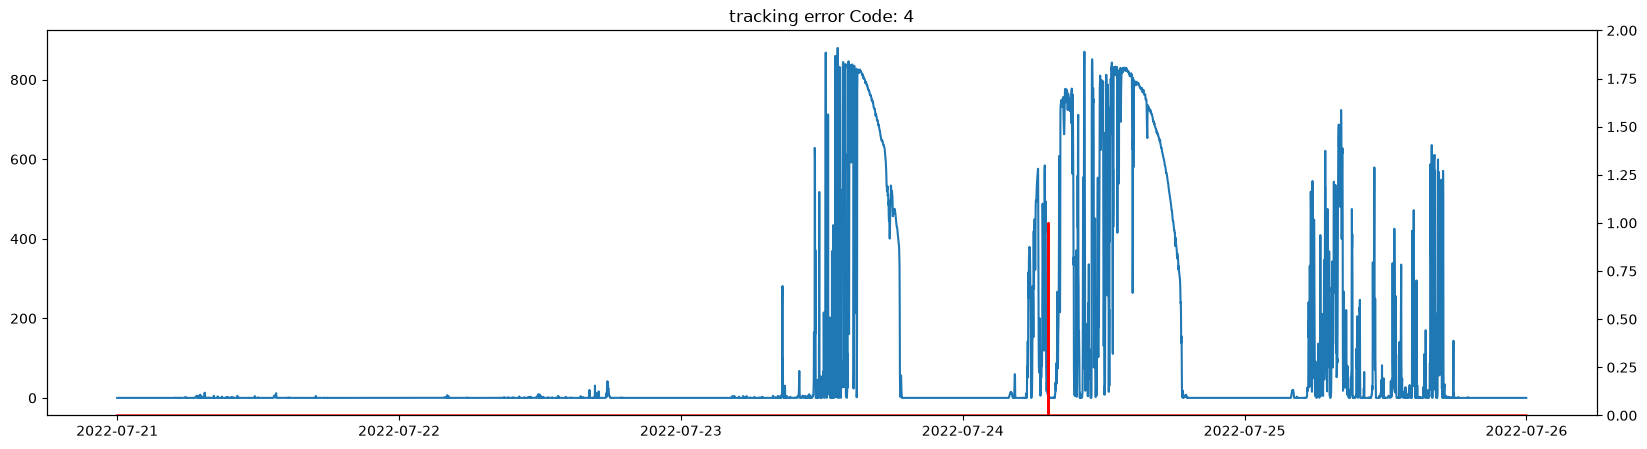
- Schmidt, T., Stührenberg, J., Blum, N., Lezaca, J., Hammer, A., & Vogt, T. (2023). A network of all sky imagers (ASI) enabling accurate and high-resolution very short-term forecasts of solar irradiance. IET Conference Proceedings, 2022(23), 372–378. 10.1049/icp.2022.2778