The Solar Radiation Monitoring Laboratory (SRML) at the University of Oregon has been providing solar irradiance data for the Northeastern United States since 1975. The SRML monitoring station network consists of both high-quality stations that measure all three irradiance components at a 1-minute resolution, as well as stations with low-quality instruments that only log measurements hourly. A full list of the 42 stations (including discontinued stations) can be found at the SRML website.
Only the high-quality SRML stations are included in the SolarStations.org’ station catalog; however, all active stations are shown below.
Data retrieval
Data from the SRML stations are stored in monthly files for each station and can be freely downloaded from their website. The data can also be downloaded programmatically using the pvlib-python library, specifically the pvlib.iotools.get_srml function. If you use pvlib iotools for published work, please cite Jensen et al. (2023) which provides additional background information. A list of the station acronyms can be found here.
An example of how to use pvlib to download data from the Hermiston station for June 2020 is shown here:
import pvlib

data, meta = pvlib.iotools.get_srml(
    station='HE',
    start='2020-06-01',
    end='2020-06-30',
    url='http://solardata.uoregon.edu/download/Archive/')

show(data.head(), scrollX=True, scrollCollapse=True, paging=False, maxColumns=100, dom="tpr")
Output
The data retrieved from the Hermiston station include measurements of the three irradiance components and additional weather parameters including temperature and humidity. A few of the parameters in the downloaded datasets are visualized below.
Source
axes = data[['ghi_0','dni_0','dhi_3','temp_air_1','wind_speed_1']].plot(
    subplots=True, legend=False, rot=0, figsize=(6, 6), sharex=True)

# Set y-labels and y-limits
axes[0].set_ylabel('GHI [W/m$^2$]'), axes[0].set_ylim(-10,1400)
axes[1].set_ylabel('DNI [W/m$^2$]'), axes[1].set_ylim(-10,1400)
axes[2].set_ylabel('DHI [W/m$^2$]'), axes[2].set_ylim(-10,1400)
axes[3].set_ylabel('Temperature [°]'), axes[3].set_ylim(0,40)
_ = axes[4].set_ylabel('Wind\nspeed [m/s]'), axes[4].set_ylim(0,15)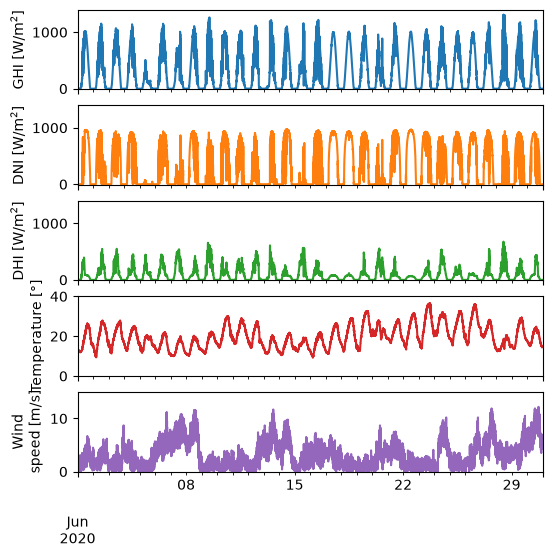
- Jensen, A. R., Anderson, K. S., Holmgren, W. F., Mikofski, M. A., Hansen, C. W., Boeman, L. J., & Loonen, R. (2023). pvlib iotools—Open-source Python functions for seamless access to solar irradiance data. Solar Energy, 266, 112092. 10.1016/j.solener.2023.112092